How to Create Hand-Drawn Style City Art Maps with Python
A step-by-step guide to transforming real-world OpenStreetMap data into stunning, customizable art maps using Python, OSMnx, and PrettyMaps. Learn to generate print-ready posters and wallpapers in minutes.
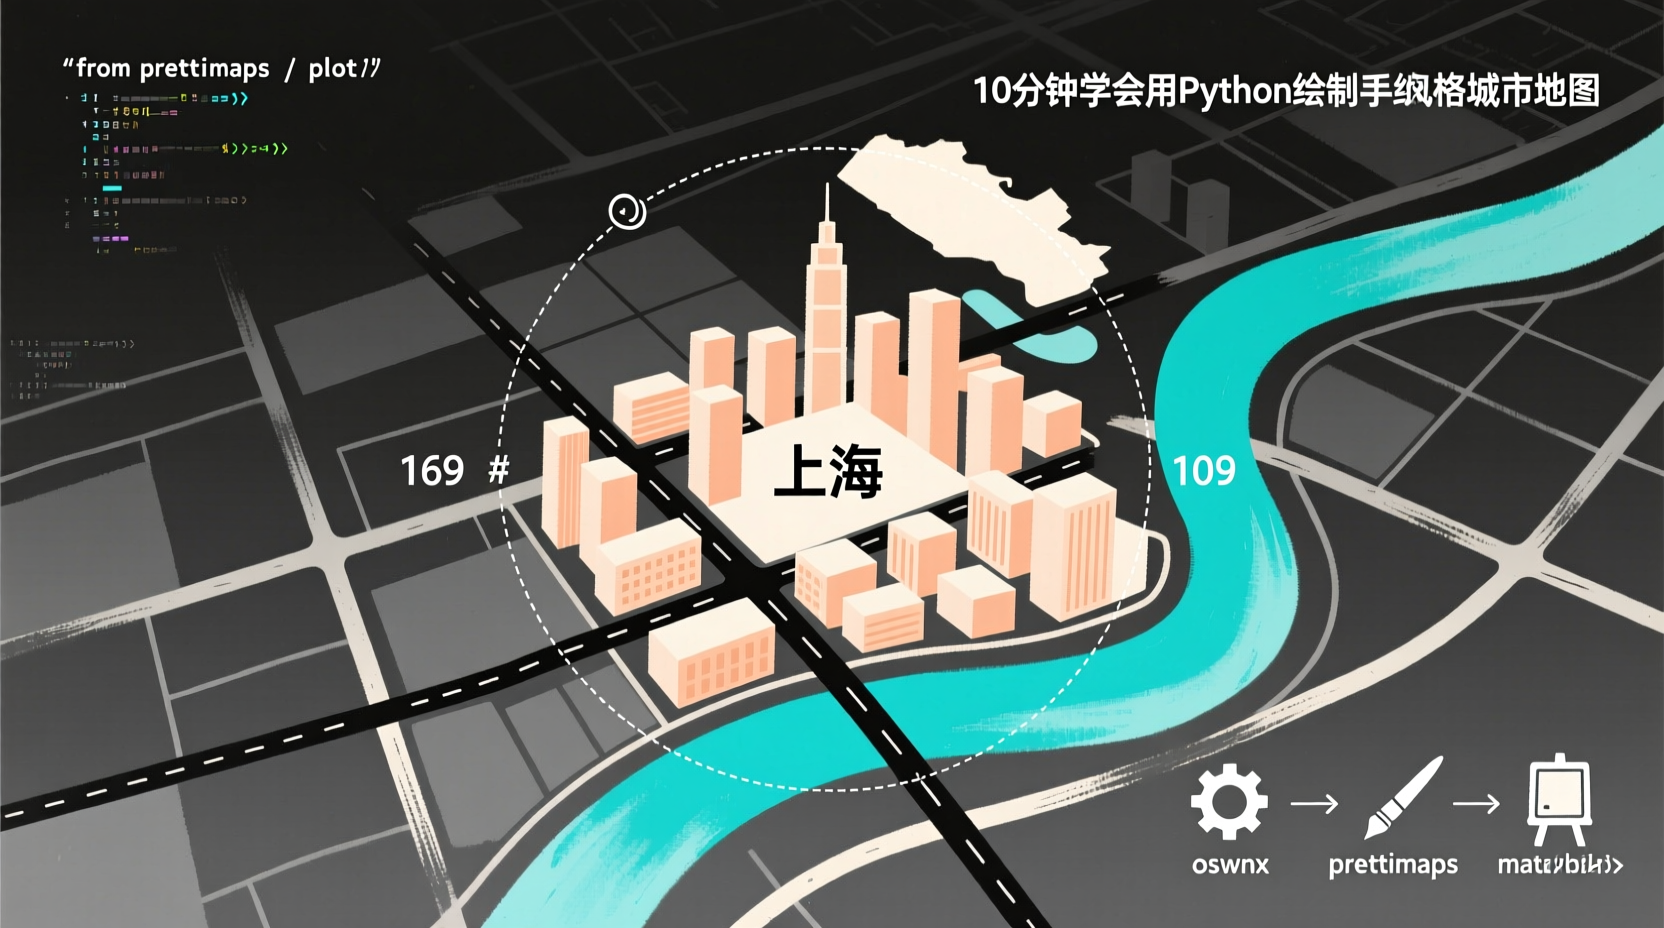
How to Turn City Data into Hand-Drawn Style Art Maps with Python
Tired of boring, ugly map screenshots in your project reports? Today, I'll show you how to turn city data into hand-drawn style art maps using Python. By the end of this guide, you'll be able to generate maps with building shadows, river gradients, and custom font labels using just a few lines of code—ready to use as desktop wallpapers or print-ready posters.
Prerequisites
You'll need Python 3.8+ and the following three core libraries:
bash
pip install prettymaps osmnx matplotlibWhy these three?
osmnx: Fetches real geographic data (roads, buildings, waterways, etc.) from OpenStreetMap.prettymaps: Converts the data into highly customizable Matplotlib figures.matplotlib: The underlying rendering engine that handles plotting and exporting.
Tip: If Windows users encounter a
geopandasdependency error during installation, runconda install -c conda-forge geopandasfirst, then retry.
Quick Start: Draw Your First Map
python
from prettymaps import plot

## Parameter explanation:
## location: Address string, automatically geocoded
## circle: Radius range in meters. Larger values mean less detail.
## style: Style template, options include 'default', 'watercolor', 'poster'
plot(
    location='Shanghai, China',
    circle=10000,
    style='poster'
)
Running this will open a window displaying the generated map. Note that the first run will download and cache OSM data for the specified region locally.
Practical Guide: Customize Your City Postcard
Want to generate a map with your personal style? Adjust these key parameters:
python
from prettymaps import plot, presets

## 1. Load base configuration
config = presets.get('default')

## 2. Customize building colors
config['building_colors'] = {
    'residential': '#f5e6d3',  # Light beige for residential areas
    'commercial': '#a8d8ea',   # Sky blue for commercial zones
}

## 3. Adjust road hierarchy
config['road_widths']['primary'] = 3.0  # Thicken main roads
config['road_colors']['primary'] = '#7f8c8d'

## 4. Hide waterways (optional)
config['show_water'] = False

## 5. Export poster-quality image
plot(
    location='Kyoto, Japan',
    circle=8000,
    style=config,
    output='kyoto_artmap.png',
    dpi=300  # Print resolution
)
Parameter Breakdown:
building_colors: A dictionary where keys are building types and values are hex color codes.road_widths/road_colors: Controls the visual hierarchy of roads. It's recommended to maintain a width difference: primary > secondary > residential.output: Saves the file directly to disk without opening a preview window.
Troubleshooting & Common Pitfalls
MemoryError: Radii over 15,000 meters may cause memory overflow. Try adding thetimeout=60parameter.- Font Rendering Issues (Garbled Text): Add
font_family='sans-serif'to your config. Windows users may need to rebuild thematplotlibfont cache. - Missing Data: Remote areas might have incomplete OSM coverage. Verify address validity first using
osmnx.geocode().
Next Steps
Try combining preset templates from the presets module, or explore shapely geometry operations for boundary clipping. The official examples repository offers 30+ style templates for reference: https://github.com/marceloprates/prettymaps/tree/main/examples
Now open your terminal, type in your city name, and see what kind of digital artwork emerges!