How to Deploy a Website Intelligence Analysis Platform in 3 Minutes Using Docker
A practical guide to deploying Web-Check via Docker. Learn how to gather comprehensive website intelligence (DNS, SSL, ports, tech stack) in minutes via Web UI and API.
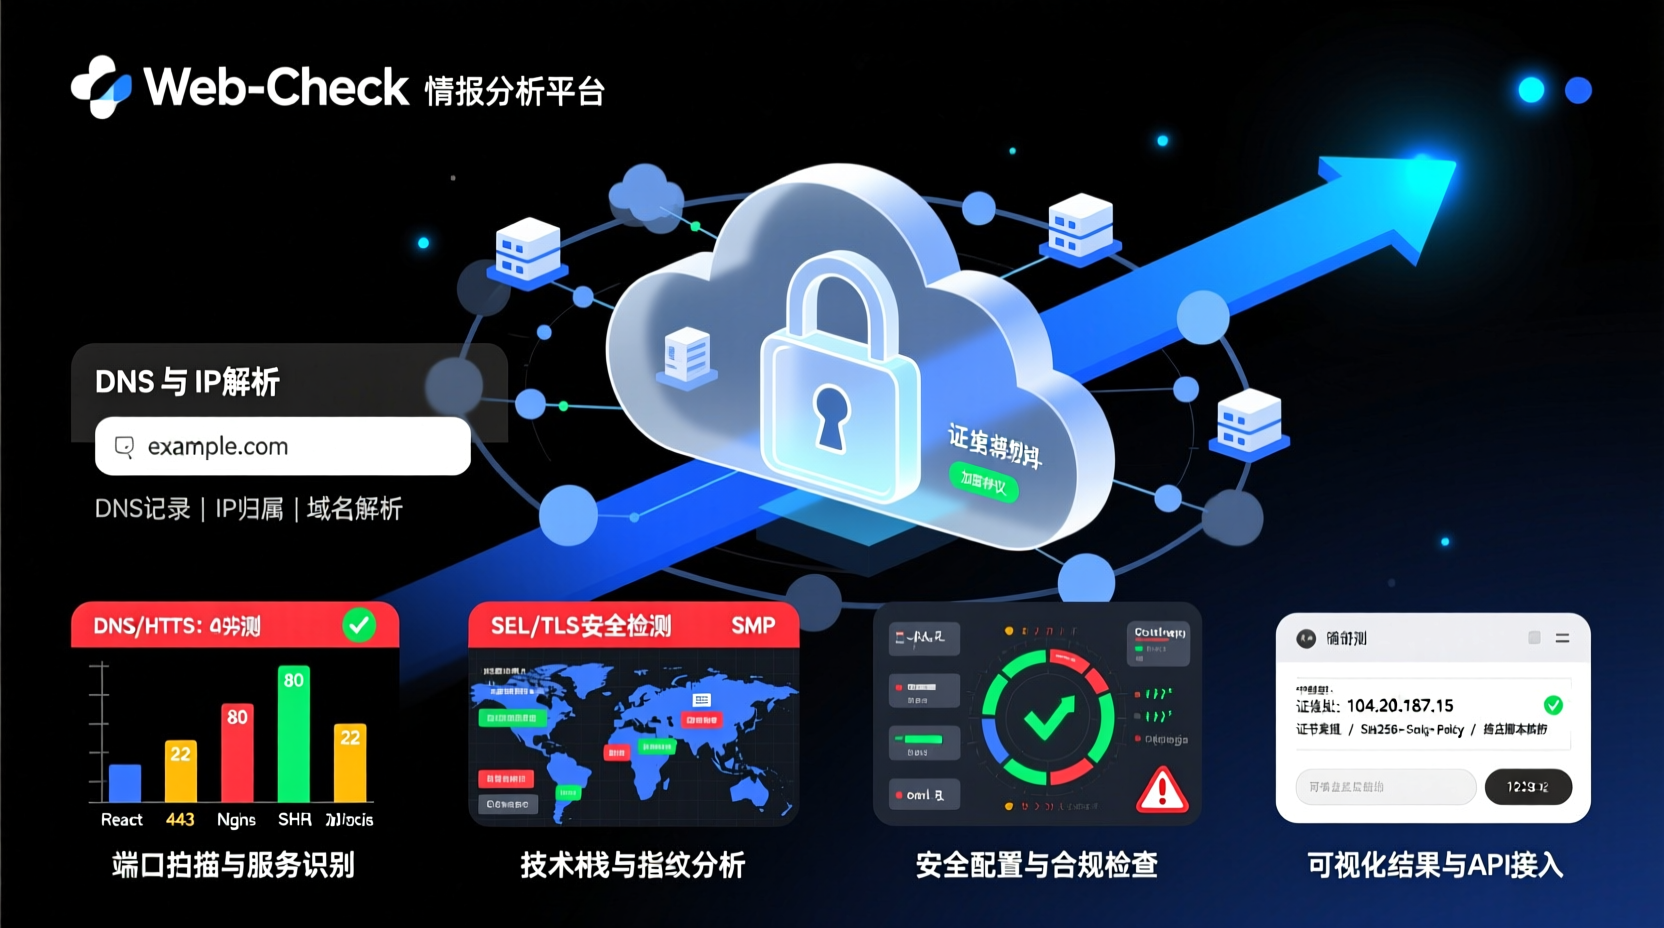
Have you ever encountered a scenario like this: you get a new client's website, or before a security assessment, you need to gather basic intelligence on a target—IP address, SSL certificate status, tech stack, open ports, DNS configuration... Checking these one by one with dig, curl, nmap, or whois is not only time-consuming but also prone to oversights.
Today, I'll walk you through setting up an open-source tool that handles all of this in one go: Web-Check. This project already has 34k+ Stars on GitHub, and its core capability can be summed up in one sentence: enter any website URL and instantly retrieve a comprehensive technical profile. From IP addresses, SSL chains, and DNS records to tech stacks, ports, HTTP security headers, and even carbon footprints—everything is visualized and API-driven.
By the end of this guide, you will be able to:
- Run it locally with a single Docker command
- Understand what it can analyze and how to use the data
- Integrate its analysis capabilities into your own scripts or toolchains via API
- Master advanced configurations like customizing checks and adding third-party API keys
Without further ado, let's dive in.
Prerequisites
| Requirement | Details |
|---|---|
| OS | Linux / macOS / Windows (WSL) |
| Runtime | Docker installed and running (Recommended) |
| Manual Install | Node.js ≥ 22.12 + Yarn |
| Optional | chromium, traceroute (required for some advanced checks; will be skipped if missing) |
If you don't have Docker yet, grab it from docker.com. The installation takes less than 5 minutes. For backend and DevOps engineers, Docker should already be a standard part of your toolkit.
Quick Start: Launch with a Single Docker Command
Why use Docker first? Because the project comes with a pre-built image, saving you from dealing with dependency installation and compilation. Simply run:
bash
docker run -d -p 3000:3000 --name web-check lissy93/web-checkI've added -d to run the container in the background and --name for easier management later. The port mapping 3000:3000 means you can access the web interface at http://localhost:3000.
Once started, open your browser and navigate to http://localhost:3000. You'll see a clean input box. Enter a domain (e.g., github.com), hit submit, and the dashboard will progressively load the analysis results.
Why is this faster than manual checks? Traditionally, you'd need to check DNS (dig/nslookup), SSL (openssl s_client), open ports (nmap), and tech stacks (BuiltWith/Browser DevTools) separately. Web-Check bundles all these capabilities into one request, running all checks and consolidating the output automatically.
Deploy from Source
If you want to modify the source code or set up for local development, you'll need to build it manually:
bash
git clone https://github.com/Lissy93/web-check.git
cd web-check
yarn install
yarn build
yarn start
Note that this requires Node.js ≥ 22.12 and the Yarn package manager. yarn build compiles both frontend and backend, while yarn start launches the API service and GUI simultaneously.
Practical Example: Create a Full Website Profile
Getting it running is just the first step. Let's run a full intelligence gathering exercise on baidu.com. After entering baidu.com in the Web-Check interface and waiting for the analysis, you'll see the following categories of information:
1. Infrastructure Details
- IP Information: Resolved IP address, geolocation, and ISP provider
- SSL Certificate Chain: Issuer, validity period, and expiration status
- DNS Records: Full display of A/MX/NS/CNAME/TXT records
- Open Ports: Scan results for common ports
- Traceroute: Network routing path for data packets
2. Security Configuration
- HTTP Security Headers: HSTS, CSP, X-Frame-Options, X-Content-Type-Options, etc.
- DNSSEC: Whether DNS Security Extensions are enabled
- Firewall Detection: Detection of deployed WAFs (Web Application Firewalls)
- SSL/TLS Configuration: Cipher suites, handshake simulation, and security grading
3. Technology & Operations
- Tech Stack: Identification of frameworks, CMS, and JS libraries using the Wappalyzer engine
- HTTP Response Headers: Server type, caching policies, and compression methods
- Cookies & Sessions: Cookie attributes and presence of Secure/HttpOnly flags
- Email Security: SPF, DKIM, and DMARC configuration status
- Indexing & History: Sitemap structure and Wayback Machine archive history
4. Additional Metrics
- Carbon Footprint: Estimated environmental impact based on page size and data transfer
- Global Ranking: Traffic ranking from the Tranco project
- Security Policy Files: Presence of
security.txt - Social Tags: SEO metadata like Open Graph and Twitter Cards
Pro Tip: If you're in the information gathering phase of penetration testing, focus on DNS records (which might leak internal subdomains), open ports (non-standard ports might indicate internal services), and SSL certificates (which can reveal organization names and related domains). These are highly valuable for red team operations.
API Integration: Plug Capabilities into Your Toolchain
Besides the web interface, Web-Check exposes a complete API, allowing you to call it via curl, Python, or your own backend services.
The API is mounted at /api by default. For example, to query a domain:
bash
curl "http://localhost:3000/api?url=baidu.com"

## Custom enabled checks
docker run -d -p 3000:3000 \
  -e API_ENABLED_CHECKS=get-ip,ssl,dns,headers \
  --name web-check-lite lissy93/web-check
The -e flag passes the environment variable, instructing the service to run only the specified checks, significantly reducing response time. For automated scripts or high-frequency calls, enabling only necessary checks is a best practice.
Advanced Configuration: Enhance Capabilities
Out of the box, most of Web-Check's features work without extra setup. However, for more comprehensive data, you can supply third-party API keys:
| Environment Variable | Purpose |
|---|---|
GOOGLE_CLOUD_API_KEY |
Enables Lighthouse performance analysis (PageSpeed Insights) |
REACT_APP_SHODAN_API_KEY |
Displays Shodan-related host information |
REACT_APP_WHO_API_KEY |
Provides more detailed Whois records |
API_DISABLED_CHECKS |
Comma-separated list of checks to disable |
API_BLOCKED_HOSTS |
Internal addresses prohibited from scanning (security boundary) |
For example, add these to your .env file:
env
GOOGLE_CLOUD_API_KEY=your_google_api_key
API_DISABLED_CHECKS=trace-route,carbonNote: Variables prefixed with
REACT_APP_are injected into the frontend code and are publicly visible. Always apply strict access restrictions and never use your primary account keys.
If deploying on a cloud server, it's recommended to set API_BLOCKED_HOSTS to prohibit scanning internal subnets (e.g., 192.168.0.0/16,10.0.0.0/8) to prevent misuse and legal risks.
Common Issues & Troubleshooting
- Port Conflict: If port 3000 is already in use locally, map to another port:
-p 8080:3000, then accesshttp://localhost:8080. - Some Checks Show No Results: This is normal. Features like Traceroute, port scanning, and screenshots rely on system tools (
traceroute,chromium). If missing, they are silently skipped. You can install the required packages and restart the container. - Request Timeout: The default timeout is 25 seconds. If a target website responds slowly, increase it via
PUBLIC_API_TIMEOUT_LIMIT, e.g.,-e PUBLIC_API_TIMEOUT_LIMIT=60000. - Slow Docker Pull: If Docker Hub is slow, use the GHCR mirror:
docker run -d -p 3000:3000 ghcr.io/lissy93/web-check. - Security Reminder: While powerful, this tool's information gathering capabilities must be used legally and ethically. Only use it for authorized testing, asset auditing, or public research. Never maliciously scan unauthorized third-party websites.
Summary
In just 3 minutes today, we deployed a fully functional website intelligence analysis platform. Let's recap the steps:
- Deploy the service with a single
docker runcommand - Query target websites via the web interface or API
- Configure environment variables on-demand to enable advanced features
- Integrate the API into your own automated workflows
Web-Check's greatest strength lies in compressing tasks that normally require 7-8 different tools into a single URL input box. For security professionals, it's an excellent companion for red team information gathering. For DevOps and developers, it's a powerful tool for quickly diagnosing website configurations, auditing security headers, and troubleshooting SSL issues. For site administrators, it doubles as an SEO and performance health check.
Next Steps:
- If you work in security testing, combine it with tools like nmap, subfinder, and httpx
- If you're in operations, deploy it on your internal network to regularly audit your own sites' SSL certificates and security headers
- If you want to develop further, its API design is very clear, making it easy to build your own security inspection platform
If you run into any issues during deployment, feel free to discuss them in the comments. If you find this useful, don't forget to Star the project on GitHub—open source projects thrive on positive feedback.